Promotion
Sign up for our newsletter to get 20% off sitewide!

By clicking “Accept,” you agree to the use of cookies and similar technologies on your device as set forth in our Cookie Policy and our Privacy Policy. Please note that certain cookies are essential for this website to function properly and do not require user consent to be deployed.
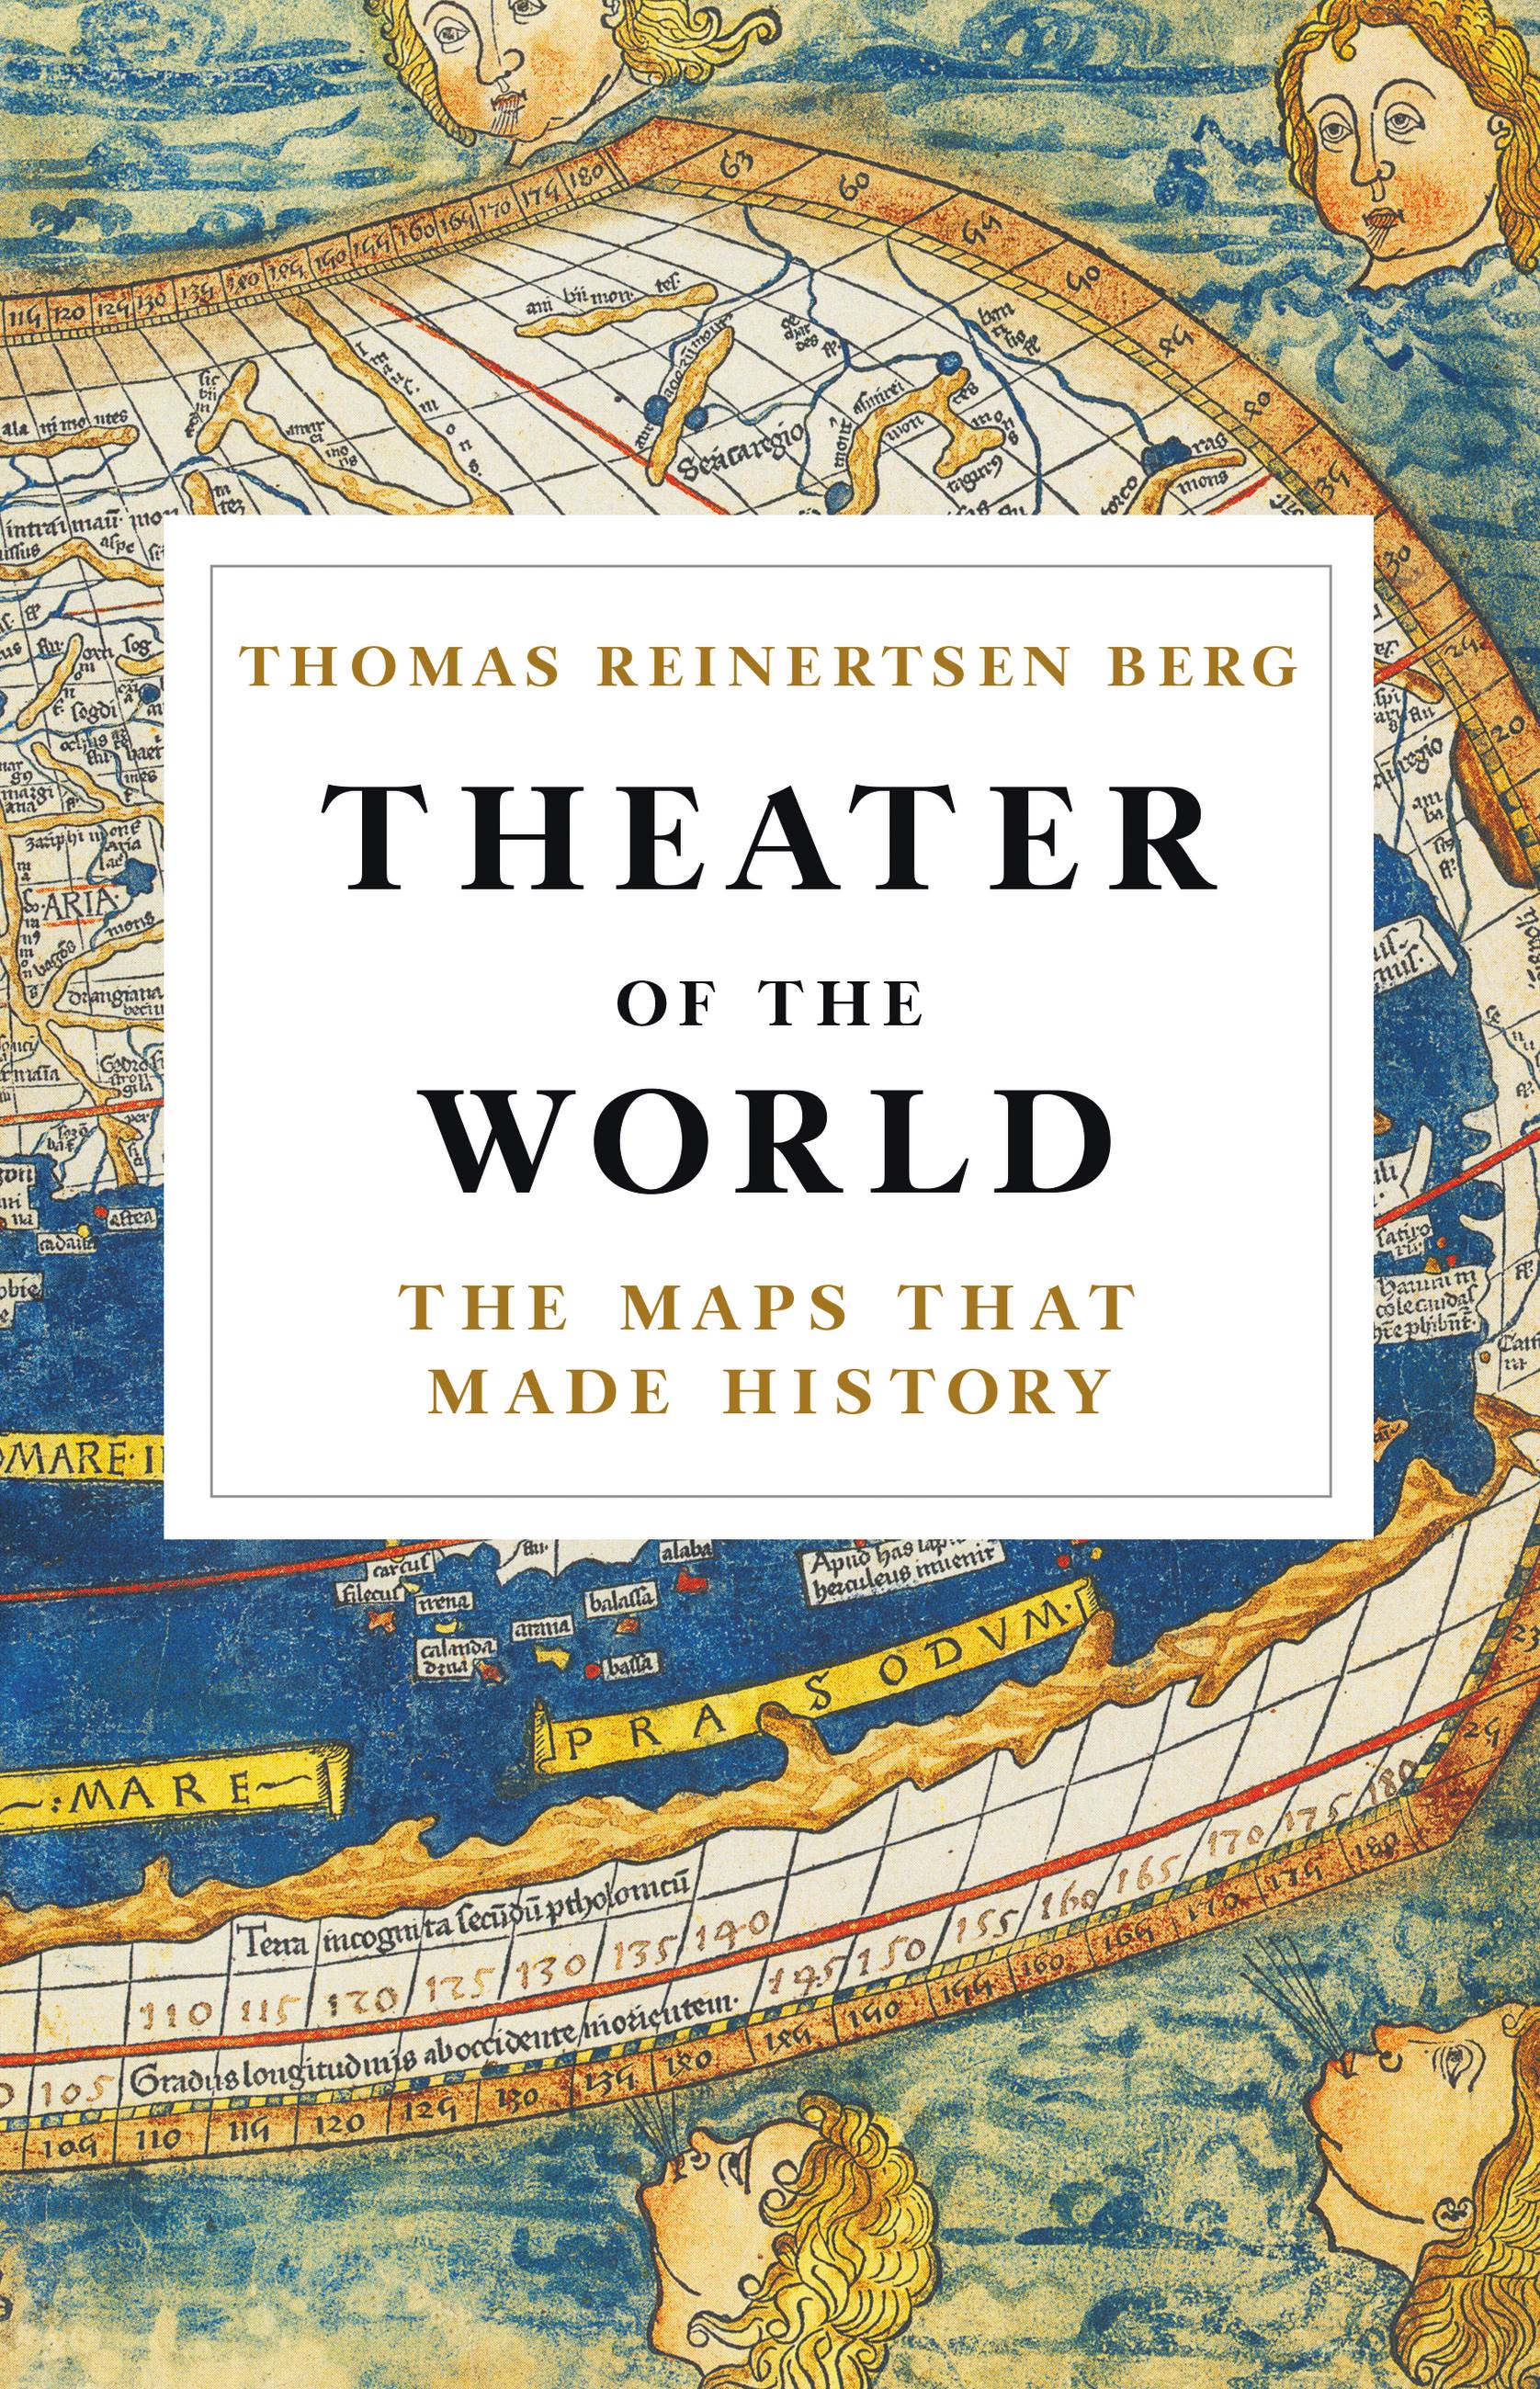
Theater of the World
The Maps that Made History

Contributors
Translated by Alison McCullough
Formats and Prices
- On Sale
- Dec 4, 2018
- Page Count
- 384 pages
- Publisher
- Little, Brown and Company
- ISBN-13
- 9780316450768
Price
$35.00Price
$45.50 CADFormat
Format:
Hardcover $35.00 $45.50 CADThis item is a preorder. Your payment method will be charged immediately, and the product is expected to ship on or around December 4, 2018. This date is subject to change due to shipping delays beyond our control.
Buy from Other Retailers:
A beautifully illustrated full-color history of mapmaking across centuries — a must-read for history buffs and armchair travelers.
Theater of the World offers a fascinating history of mapmaking, using the visual representation of the world through time to tell a new story about world history and the men who made it. Thomas Reinertsen Berg takes us all the way from the mysterious symbols of the Stone Age to Google Earth, exploring how the ability to envision what the world looked like developed hand in hand with worldwide exploration.
Along the way, we meet visionary geographers and heroic explorers along with other unknown heroes of the map-making world, both ancient and modern. And the stunning visual material allows us to witness the extraordinary breadth of this history with our own eyes.
Genre:
-
"Throughout his book, Berg provides sound analysis, reasoned arguments, and strong examples to support his assertions. The book is extremely well researched and clearly written. It is accessible to a general audience, and would be of interest to anyone who enjoys history or maps. While Berg acknowledges that no one can write a book covering all of the history of mapmaking, Theater of the World provides an excellent foundation in the general history of mapmaking in Europe, and the history of Norwegian mapmaking in particular."Carolyn Hansen, Cartographic Perspectives
-
"A fascinating book that I will always treasure."Sir Ranulph Fiennes
-
"This wonderful book is a reminder of how much careful thought was given to the shape of the world even in ancient times - the landscape, how places are related to one another. I pored over these maps for hours, imagining those minds hard at work, visualising how it all connected as a whole. Just brilliant."Neil Oliver
-
"In his gorgeous book, 'Theater of the World,' Thomas Reinertsen Berg provides dozens of full-color maps along with fascinating details about the history of attempts to represent geographical space...Readers can expect to spend happy hours with this book, tracing routes and reading reports of adventuring navigators."Lorraine Berry, The Washington Post
-
"Thomas Reinertsen Berg's THEATER OF THE WORLD: The Maps that Made History is a thorough study of cartography, past and present. But more than that, it's an exploration of what maps mean and why we'll never stop trying to document the world arounds us."Hannah Walhout, Travel + Leisure
-
"This engagingly Illustrated four-color history detailing mapmaking from the antiquities to the modern day is a treasure-trove for real and armchair travelers."John J. Kelly, The Detroit Free Press
-
"Fascinating...sumptuously produced with lots of full-colour images, is a kind of potted treasury of cartographical history that gleams with piece-of-eight-like snippets of information...this is an enthralling book, and joins the likes of Simon Garfield's On the Map and Jerry Brotton's A History of the World in Twelve Maps in the field of popular reaffirmations of the ingenuity of geography."Travis Elborough, The Spectator
-
"This beautiful collection of historic maps will resonate with folks prone to wanderlust and those longing for a sense of place. A Norwegian journalist mines the human desire to explore while sharing lush cartography from the Stone Age to the age of exploration to modern satellite imagery."Garden & Gun
-
"Armchair travelers and international adventurers follow maps around the world, and in this handsome and compelling book, Norwegian journalist and writer Berg focuses on the creation of maps. Segueing from Stone to Internet Age, he relates stories of how maps were created, reflected value judgments, and shifted over time. Berg's idiosyncratic book is not merely a collection of maps but rather a cartographic history - a rich, diverse story of how art, technology, and human impulses jostle, with mapping and money hand in hand, raising the question of whether Google is too dominant a force in the map service business."The National Book Review
-
"The visual exploration that is Theater of the World: The Maps that Made History makes for the perfect bonding experience with you and your pops...Feast your eyes on the vibrant history of mapmaking and its illustrated evolution across centuries. Best enjoyed amongst history buffs in a cigar-filled study with leather armchairs."Jahla Seppanen, The Manual
-
"Visually stunning...it's gone straight to the top of my Christmas present list."The Bookseller