Promotion
Free shipping on $45+ Shop Now!
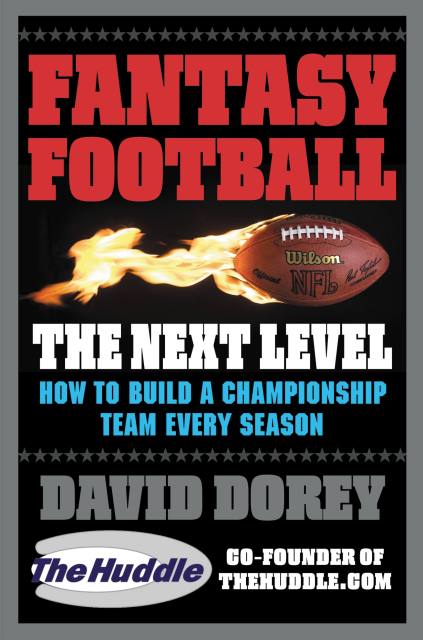
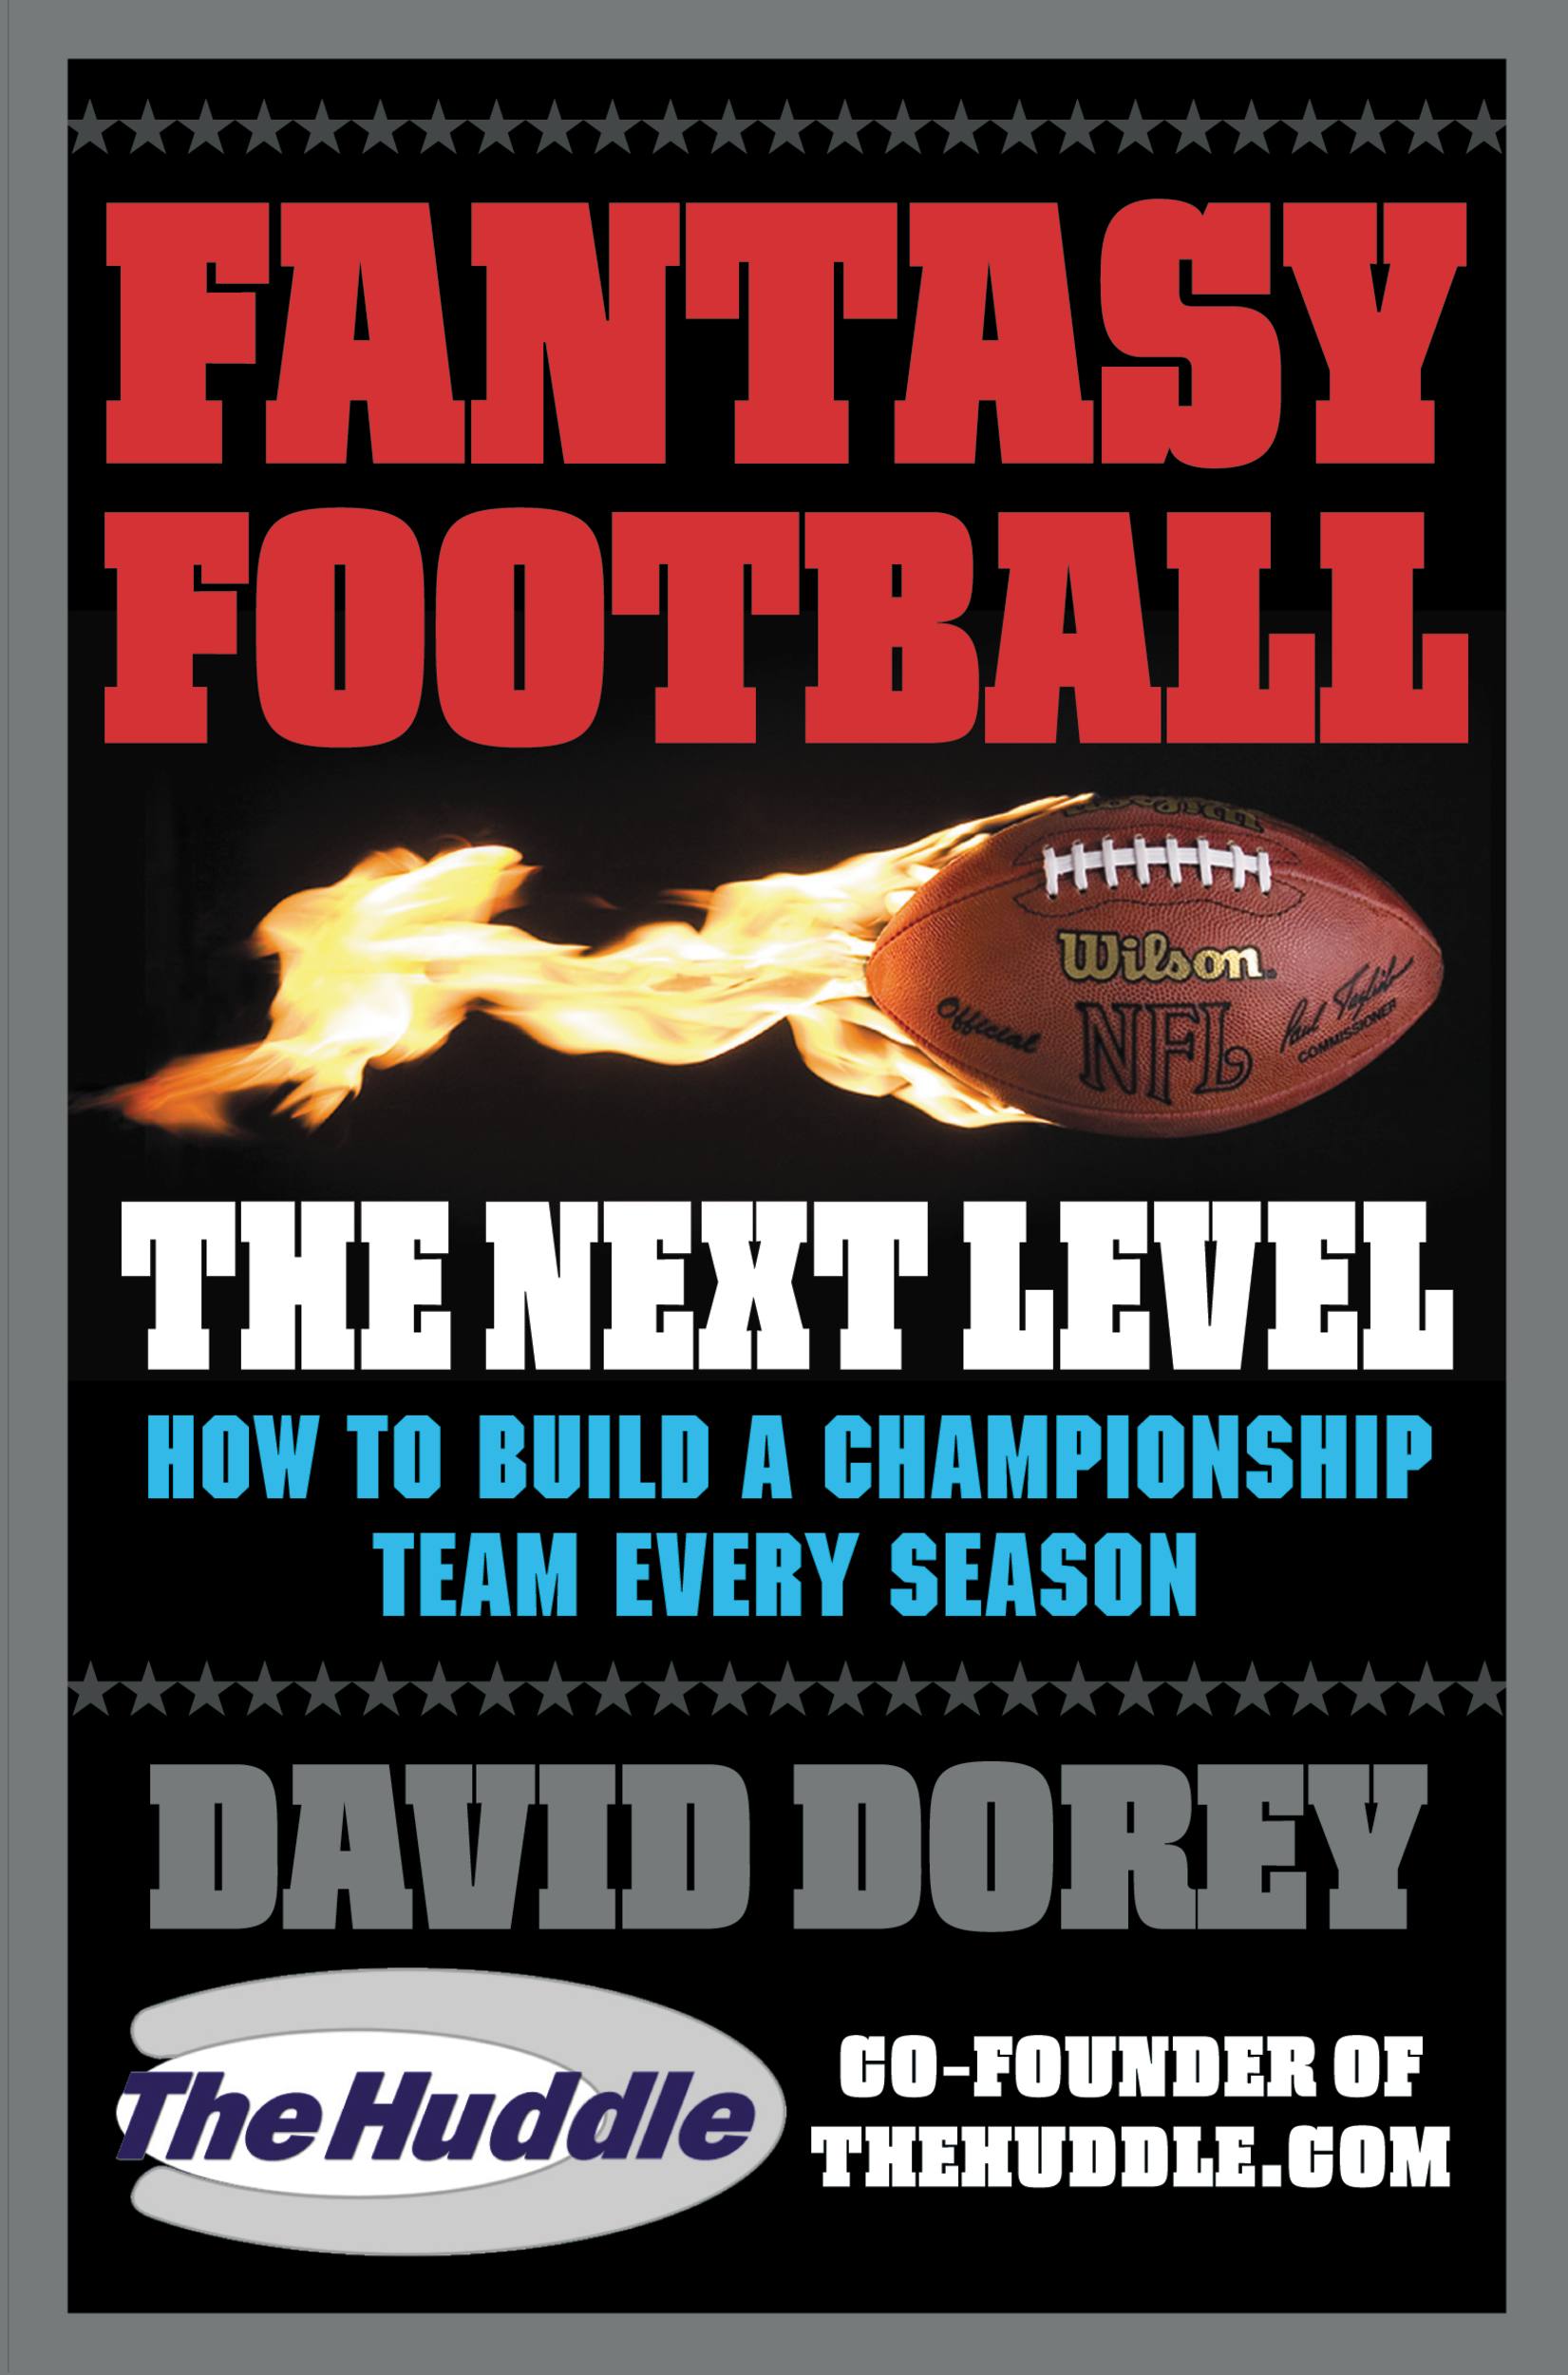
Fantasy Football The Next Level
How to Build a Championship Team Every Season
Contributors
By David Dorey
Formats and Prices
Price
$8.99Price
$11.99 CADFormat
Format:
- ebook $8.99 $11.99 CAD
- Trade Paperback $21.99 $28.99 CAD
This item is a preorder. Your payment method will be charged immediately, and the product is expected to ship on or around August 1, 2007. This date is subject to change due to shipping delays beyond our control.
Also available from:
Learn how to:
Understand the true value of each position to your team’s success using LAG analysis
Get a handle on your league’s scoring system and use it to your advantage
Keep your focus and your discipline on draft day using the Advanced Draft Tracker
Ignore the hype surrounding last year’s superstar–and build your team with players who will produce this season.
Excerpt
Acknowledgments
Any book is the product of long hours spent left alone, but it is only through the love and support that my wife, Karin, and son, Brian, have given that allows me a career in a field that most people consider only as a pleasure. It's never a solitary pursuit knowing that the meaning of life is just down the hallway.
I was once described as a jack of all trades and a master of most (no, really, I was). For that I would most need to thank my parents. Somehow I inherited both my father's sense of analytical perfection and my mother's love of writing and humor. Put them together in the Internet age and you get a Web site, even if they still struggle to explain to their friends what I do for a living.
I would also be remiss in not recognizing my friend and business partner Whitney Walters, who nudged me in a local draft in 1996 and mentioned "we should open a Web site." The Huddle has been a huge part of my life for over a decade now and remains my passion and purpose. It would have never been possible without Whitney's vision and hard work, nor would it have been as thoroughly enjoyable and life-changing. If it all went away tomorrow, it would always be the most exciting thing I have done.
This material banged around in my head for a few years but it took teaming up with my literary agent, Byrd Leavell III, to recognize the possibility after we fleshed out the bones that would become this book. The reality was realized thanks to Warner Books for giving me the only thing in life I've ever really wanted—an opportunity.
Lastly I must thank the thousands of Huddlers from the past decade who have graciously given me a reason to stay up late nights pounding away on the keyboard doing what I love to do. I have greatly enjoyed interacting with you all on the message board, on the phone, via e-mails, and even in person. Lou Gehrig was the first to say it and I may not be the last, but I honestly believe I am the luckiest man in the world.
CHAPTER 1
UNDERSTANDING YOUR
LEAGUE USING LAG
Question: What feat did Emmitt Smith accomplish three times but Terrell Davis only managed once in his career?
Answer: Both runners led the NFL in rushing yards in the same year that they were on the winning Super Bowl team. Larry Brown managed to reach the Super Bowl in 1972 with the Redskins but they lost, as did Shaun Alexander with Seattle in 2005. This means that 36 times over a 40-year period, having the most productive running back did not translate into winning the league championship.
HOW CAN THIS BE? We all know that running backs are the big guns for offenses and that having a good rushing game in the NFL, like in fantasy football, is paramount to winning championships. How can it be that having the most productive tailback in the entire league was not enough to reach and win the Super Bowl 36 times in the first 40 years? And not even once in the first 26 years of the league championship?
The truth for the NFL is no different from the truth of your fantasy team—one player does not make for an entire team. Even if you had a magical crystal ball that could guarantee which player would be the highest scorer in your fantasy league that year, would that alone be enough to win? Probably not. And oh yes, that assumes you even had the chance to draft him. Your weekly success comes directly from the total fantasy points from ALL of your starting players combined going against the lineup of your opponent. The point to fantasy football is not to have the highest-scoring player (though, hey—don't we all love that), it is to have the highest-scoring team each week.
The first step to reaching The Next Level is to understand how your fantasy team scores points. All fantasy leagues do not use the same scoring rules and many like to change every season. It all matters. A team that may win a championship handily in one league may struggle to reach the playoffs in another depending on how fantasy points are awarded. You cannot build an optimal team until you understand two very critical aspects of your league scoring—how it affects player values within a position and how it affects positions compared to each other.
After a decade of working at The Huddle Web site and having been in contact with literally thousands of fantasy owners, the most common advantage that I have seen in fantasy leagues pertains to understanding the league scoring. It is an area that those who make the rules occasionally use to their own great benefit by drafting differently from the more casual owners. While certainly not all leagues have rule makers with nefarious intentions, playing fantasy football at The Next Level means approaching every draft differently unless, by some odd chance, those separate leagues have the exact same league rules.
The reality is that the majority of fantasy players only rely on the previous season's statistics from their league to determine their rankings and draft plans. That is an obvious and important tool to use for understanding your league, but most think of it by names and numbers. Figure 1.1 is an example of what someone could have seen at the end of the season in their league.
What most fantasy owners in that league would immediately believe is that they need to grab two running backs, since they have the highest scores, then a quarterback, and then eventually a couple of wide receivers before settling on a tight end. Grab the kicker and defense when the runs start on those positions. They then arm themselves with a player ranking that looks suspiciously similar to the statistical results of last year and go into their drafts with the express aim to build a killer team based on the previous season. This brings up the first important rule of fantasy football:
Figure 1.1
Rule 1
__________________________
Draft your team for this year,
not from last year.
While this idea will be much expanded on later, this is likely the biggest weakness and most natural tendency of fantasy team owners, young and old. As your expertise increases, it becomes enlightening to watch other team owners draft as if they are armed with nothing more than the stats from last year. They are picking those highest-scoring players from the previous season while knowing that they could have a monster team—if only they had a time machine that could go back 12 months.
Setting up your draft for THIS year is done by first forgetting about individual players and initially focusing on the team that you will build. To do this you must understand the effect that fantasy scoring rules have on positions, and the best way to accomplish that is with a League Analysis and Graphing (LAG). A quick and relatively easy process, a LAG can open your eyes about the unique characteristics of your league and should be a mandatory activity even if you do nothing more than pick up a cheat sheet on the way to your draft.
What you will need is a listing of the top 20 scorers in all positions used in your league from the previous season. If this is a new league for you, then you'll need to have that scoring scenario applied to the previous year's statistics. There are numerous ways to access this information:
1. Use the data you should already have from the previous year if applicable.
2. For joining existing leagues, ask a member from last year for the information.
3. For new leagues, use an online or desktop league management product that can generate the numbers for you. Many allow free use in the preseason.
4. Figure them all out manually, or use the power of a spreadsheet to calculate them using a formula against last year's stats.
A spreadsheet can be a very powerful tool and well worth the investment in time and effort to learn at least the basics of its use. Plus if you have a desk job, you can use a spreadsheet for fantasy football analysis while at work since it certainly looks better than surfing the Web or playing online poker when your boss walks past. There are numerous places on the Internet to access at least the raw stats, including The Huddle, and you can easily just copy them from the Internet and paste them into a spreadsheet.
Considering a very basic scoring system that rewards touchdowns and yardage but no reception points, and basic scoring for kickers and defenses, it could end up looking similar to this sample season:
Figure 1.2
Using the previous year's stats allows the best accuracy, but the reality is that in any given year almost the same thing happens in position scoring. The top three scores in each position may vary but the differences between the others are minimal. Every year, the differences between the fifth, 10th, 15th, and 20th highest scorers rarely exceed 2 percent or 3 percent. The names change but the numbers rarely do. In the event they do change—usually because of a new league scoring condition or a significant rule change in the NFL—performing this type of analysis will keep you as up to date as possible.
While these numbers alone could be used for a review of position and player value, the power of a spreadsheet lets us move one easy step further to give us an immediate view of how this particular scoring scenario has affected the player values. After highlighting the above table (figure 1.2) and clicking on the graphing button, a line graph can be easily drawn that would yield the table in figure 1.3.
Now that we have a graphical expression of the top 20 players in each position, we can proceed to do a League Analysis and Graphing. There are two critical aspects of a graph to understand—how quickly player values diminish within each position and how positions compare to each other. Once you learn how to create a LAG for your league, it is a quick and easy process that should be done each year for every league you are in. Quite simply, it shows everything you need to know about player value in your particular scoring system for all positions that you will be drafting and later starting each week.
Many fantasy players become so engrossed in generating their own player projections and rankings that they overlook how past season stats apply to fantasy positions in their unique league scoring rules. A player at The Next Level understands what positional value is all about before worrying about which name to call in August. It may fly in the face of the player-centric NFL these days, but reaching The Next Level means understanding in order the three components that matter most—team first (rules and requirements), position second (comparative values), and player names third. A bit backward from how most view fantasy football but important enough to become our second rule:
Figure 1.3
Rule 2
_______________________
Success is about team first,
positions second, and players third.
Getting the stud fantasy player is an obvious benefit to your team, but unless your league only starts one player each week, that's not enough to win. In the NFL, only five times in the first 40 years has the most productive running back in the league been able to hold the Lombardi Trophy in January. It's all about the team and winning the championship, not just having the best player. What exactly is your goal every season?
CHAPTER 2
LAG Analysis: Fantasy
Scoring by Position
"Raw statistics are like a girl in a bikini. Sure, it is revealing but it often takes a lot more work before you can see everything."
MOST FANTASY TEAM OWNERS are familiar with statistics, and those numbers are easy enough to review and determine which position is the highest-scoring. Then again, most fantasy owners also end up around .500 on their season and out of the playoffs. There are more to those numbers than many realize.
The NFL produces roughly the same number of fantasy points per position every season. Using a basic fantasy scoring system that awards .05 point per passing yard and three points per passing touchdown, consider a five-year block of quarterback scores (see the next page).
The biggest variation we see here is with the top three players. That will hold true for literally every other position. Each season produces at least two or three top players that are significantly better than the rest, and their fantasy points will rise and fall far more than the other spots along the lines for season production. Basically, the top three will either turn in big years or they will turn in monster years.
Certainly you could use an averaged set of numbers, but the return is not significantly different from just using the previous season. This brings up our next rule, which is critical to remember when dealing with statistics:
Rule 3
_________________________________
Statistics—whether actual or projected—
are only useful as guidelines.
Remember, we are interested in what is behind the statistics. Consider the top 20 scores for quarterbacks from a sample season:
1 298
2 281
3 263
4 253
5 250
6 244
7 241
8 239
9 233
10 228
11 221
12 218
13 212
14 204
15 196
16 193
17 183
18 182
19 176
20 168
And the resulting graph (see figure 2.1).
In reviewing each position, there are two characteristics of interest.
Figure 2.1
1. How steeply the line declines over the set of players.
2. Any portions of the line that create a natural tier, or significant drop-off to the next player.
The angle of descent of the line indicates how quickly value is lost from having the first, 10th, or 20th best quarterback. Using the sample above, it's easy to see that having the best quarterback is worth about 50 points more than the fourth best in this scoring scenario. If we waited and hope to rely on the 15th best quarterback, you know you are giving up about 100 points in this scoring scenario. But the line is steep only for those first three players or so; otherwise the decline is gradual. Good things to know when we later compare positions and determine which positions we need to draft in what order.
Figure 2.2
For this example, there is a natural tier after the fourth best quarterback—there aren't any other significant drop-offs. In other positions and using different scoring rules, quite often there are other natural tiers and occasionally they can be dramatic. In this particular sample, the angle of descent is largely smooth and consistent, which suggests that selecting your quarterback in a draft can be done strategically because you will already know what the point effect of waiting longer will be, particularly when you know what teams already have quarterbacks and how many are likely to be taken between your current pick and next pick.
After viewing the graph, there is one other step to perform that makes the reality of this scoring situation more clear—it will be especially useful later when we are comparing positions.
3-10-20 Analysis
Using the top 20 scores for the position, a breakdown can show even more. By averaging the top three scores, the fourth through 10th and the 11th through 20th highest scores show what the difference truly is in your league for your particular scoring rules (see figure 2.3).
A 3-10-20 analysis is one of the best tools for determining how value declines in a position in your fantasy scoring scenario. Why average? Because there is almost always a top three tier for a position and the 4–10 numbers are representative of the rest of the starters drafted in your league. The 11–20 numbers are the backup/second tier players that team will have on their rosters. This may seem to beg the question "why not make it 3-12-24 for a 12-team league?" You can—the difference is not that significant. The primary purpose of these tiers is simply to understand the differences between great, good, and backup-quality quarterbacks without being blinded by your personal preferences on individual players.
The sample shows that burning that early pick on a quarterback will net you around 280 points for the season. Waiting a bit longer is a decrease, but only about 40 points or so in this particular scoring scenario. Delaying your starter until the first dozen or so are taken will likely cost you around another 50 points per season. In this sample, the difference between a top quarterback (280 points) and waiting until the starter run is over (195) is going to mean giving up roughly 90 points in a season or around five or six points per week (at least). This is assuming you get an average (those ranked 4–10) quarterback. As we will discuss later, the consistency and reliability diminish far faster than total numbers will.
In different scoring situations, the graphed line can be sharply declining, which means the better the player you get in that position, the more advantage you will have. In other scoring rules the line could almost become flat, which screams out that taking an early player in that position makes virtually no sense at all if there are other positions to draft that will net you a far higher overall gain.
Figure 2.3
The same goes for natural tiers. It is not at all uncommon for tiers to be created for the top three, then again around the eighth to 10th spots, and again around the 20th spot. What is important is that you know what your specific league scoring rules do to player statistics.
Performing a LAG graph and then a 3-10-20 analysis provides you with the invaluable knowledge of how valuable players are within a position. It can give you a realistic feel for how value declines within a position and what you gain or give up when you make your selection of a top, average, or below-average player. The numbers don't change much from season to season, just the names do. Understand the position first, and you will better recognize what value a player is bringing to your team.
Fantasy players love statistics. The problem is they can be easy to get lost in and can even become misleading taken by themselves. Performing a LAG literally shows you how your specific scoring system relates to NFL players. The process can be done in a few minutes once you are familiar with reproducing the numbers into a graph and pulling out the three levels of players for review.
The LAG is crucial for recognizing natural tiers produced by your scoring system and adjusting your strategy to that reality, but, as important as it is to understand value within a position, it pales in comparison to the value of knowing how positions compare to each other. The LAG and the 3-10-20 analysis are about to get a whole lot more revealing.
CHAPTER 3
LAG Analysis: Scoring
Between Positions
"Heroes trumpet the story of battle but it takes an army to win a war."
WHILE PERFORMING A LAG and a 3-10-20 analysis will yield invaluable information about how player value declines within a position, this alone won't win your league unless it only uses one position. Not likely. Just as the military needs separate branches to wage war, your fantasy team will use various positions each week to produce a point total. It is this total team score that matters, and it is crucial to understand the separate positions both individually AND combined to recognize where player value truly lies for your roster. The goal of a LAG analysis is to know when to draft different positions.
Consider the sample league fantasy points (see figure 3.1).
Looks like just a bunch of numbers, really. You can look across each row to see what each relative scorer does in the different positions and it's easy enough to see which positions have the highest scores by glancing at the #1 scorer in each position. But does this always hold true? At what point do positions change their importance relative to all other positions? This sort of number table is not all that useful and can be confusing. Even worse, it can be misleading if we just glance at the #1 scorer in each position and then assume that all positions decline at the same rate.
Turning it into a graph makes the relative values of positions come to life (see figure 3.2).
Figure 3.1
Figure 3.2
Now that we have an easy-to-read, graphical expression of what our sample league is about, we can proceed to make comparisons and determine how these specific league scoring rules affect the relationships of the positions used. This graph shows that in this particular league, running backs are prized possessions for the first half dozen or so, and that wide receivers never gain as many comparative points as do the running backs. The first dozen or so running backs are still scoring more than the third best wideout. Other than the top three kickers and defenses, there appears to be minimal difference in owning the fourth best or the 14th best in those positions. And if you are relying on owning a tight end that makes any difference, you better be first or second in line.
Remember—this is true only for this particular league scoring and not necessarily for yours. And our concern for now is just to understand the positions—we'll figure out how to fill in those ranked names within positions later. Breaking the fantasy points per position down into a 3-10-20 analysis, we gain even more insight:
Figure 3.3
While we are making our draft plans, it is now evident that the biggest decline in fantasy points comes with running backs (yeah, I know, you already thought that). It is obvious that grabbing a top running back in this scoring system means having an immediate scoring advantage over the rest of the league. It also probably means that you have one of the first three draft picks. As we will discuss in later chapters covering each position, the knowledge gleaned from a 3-10-20 analysis of scoring has to be matched up with the reality of how positions are raided in your league draft.
As far as top players go, this scoring scenario does not suggest that taking an early quarterback will pay much dividend, despite being the second-highest-scoring position. There is only a 39-point advantage to having a top three quarterback compared to having an average starter in this league. So realistically, quarterbacks likely will not be drafted nearly as fast as most other positions here. However, figure 3.3 shows a big advantage from snatching up that top tight end because there is a 53-point drop in waiting outside the top three. This is even more dramatic considering that, outside of those precious few high-scoring tight ends, the graph shows the position is almost worthless.
In this scoring, wideouts consistently are the least declining position outside of kickers and defenses. The difference between a top three wideout and waiting until the first wave is drafted would only cost you a mere 37 points—about two points per week. Wide receivers are a group of players with specific considerations, to be sure, but overall this scoring suggests seeding your roster with them only after securing a couple of running backs and a top tight end if possible.
The kicker scoring used here was just standard points—three points per field goal and one point for a successful extra point. Taking into account an overall view of the scoring, they just don't matter much here, nor do defenses in the minimal scoring awarded. Both lines are almost flat, which is borne out in the 3-10-20 analysis by the almost insignificant drops in scoring by waiting on the position. Having the best kicker or defense here versus having one of the worst starters in the league likely only accounts for around two points per game—Oh boy!
This initial review of the league can be revealing about how positions compare and how quickly value declines. Best of all—it applies specifically to your league rules. This is vital, since each fantasy league has unique scoring rules that will affect a LAG, and those positions will roughly score the same each season. You will already know what is going to happen.
To illustrate my point, let's spit out another LAG using different scoring rules. Our previous sample league used fantasy scoring that awarded three points per passing touchdown, six points per all other touchdowns, 0.05 point per passing yard, and 0.1 point per rushing or receiving yardage. Kicker points are standard, and defenses just get sacks, turnover, and touchdown points. The next sample league awards four points for passing scores, one point per 20 yards passed, a negative one point per interception, one point per 10 yards rushed or received, throws in a one- or two-point bonus for longer field goals, and gives points for defenses that hold down opponent points to five or fewer points. And oh yes, the biggest change of all—one point per reception. A sample year produces the scoring in figure 3.4.
Figure 3.4
Just a couple of scoring changes made some significant differences. Top scores are higher and the differences between positions are already showing major discrepancies. Graphing it out gives a picture much different from our first sample league.
Figure 3.5
There is a lot more natural tiering happening here and some critical differences that this scoring produces compared to the first sample league. There is a major tier happening around the fourth best running back and a sharper decline in the line. Quarterbacks drop off around the fifth best, so getting "early quality" looks like a worthy advantage.
Genre:
- On Sale
- Aug 1, 2007
- Page Count
- 320 pages
- Publisher
- Grand Central Publishing
- ISBN-13
- 9780446198585
Newsletter Signup
By clicking ‘Sign Up,’ I acknowledge that I have read and agree to Hachette Book Group’s Privacy Policy and Terms of Use