Promotion
20% off + free shipping on $45+ with code: SPOOKY23 Shop Now!
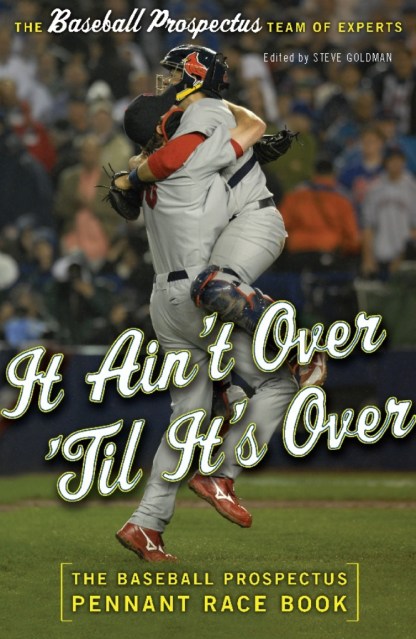
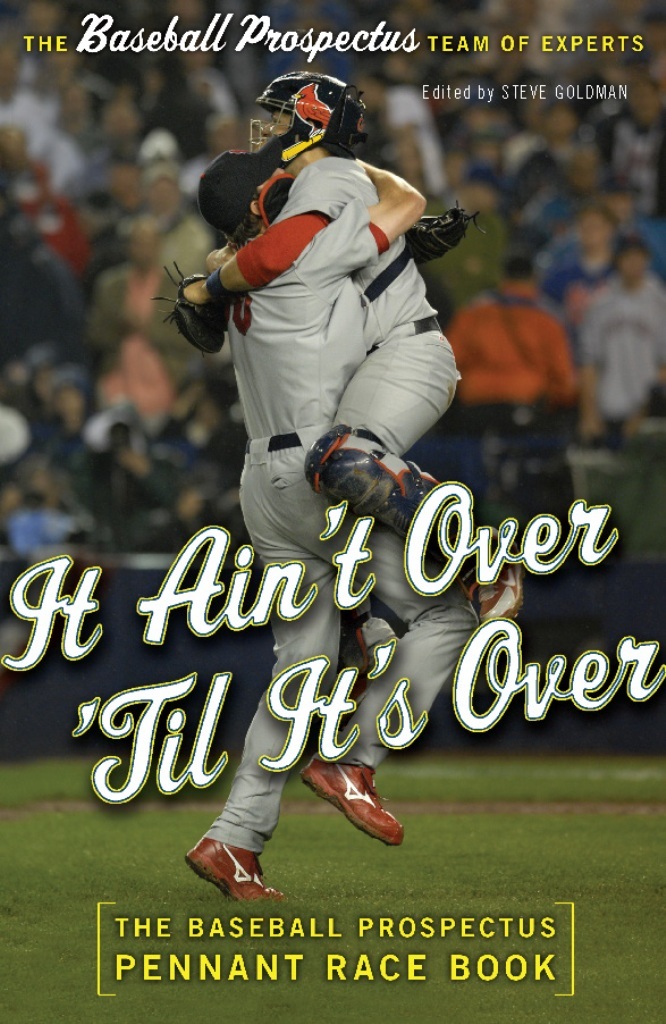
It Ain't Over 'Til It's Over
The Baseball Prospectus Pennant Race Book
Contributors
By Steven Goldman
Formats and Prices
Price
$10.99Price
$13.99 CADFormat
Format:
ebook $10.99 $13.99 CADThis item is a preorder. Your payment method will be charged immediately, and the product is expected to ship on or around August 1, 2007. This date is subject to change due to shipping delays beyond our control.
Also available from:
Excerpt
IT AIN’T OVER
’TIL IT’S OVER
BASEBALL PROSPECTUS
The Baseball Prospectus Annual (1996-present)
Mind Game (2005)
Baseball Between the Numbers:
Why Everything You Know About the Game Is Wrong (2006)
IT AIN’T OVER
’TIL IT’S OVER
The Baseball Prospectus
Pennant Race Book
THE BASEBALL PROSPECTUS
TEAM OF EXPE RTS
EDITED BY
STEVEN GOLDMAN
Copyright © 2007 by Prospectus Entertainment Ventures LLC
Published by Basic Books
A Member of the Perseus Books Group
All rights reserved. Printed in the United States of America. No part of this book may be reproduced in any manner whatsoever without written permission except in the case of brief quotations embodied in critical articles and reviews.
Basic books are available at special discounts for bulk purchases in the United States by corporations, institutions, and other organizations. For more information, please contact the Special Markets Department at the Perseus Books Group, 2300 Chestnut Street, Suite 200, Philadelphia, PA 19103, or call (800) 255-1514.
Design by Jane Raese
Text set in 10-point New Aster
A CIP catalog record for this book is available from the Library of Congress.
ISBN-10: 0-465-00284-6
ISBN-13: 978-0-465-00284-9
eBook ISBN: 9780465008407
10 9 8 7 6 5 4 3 2 1
TO BRANCH RICKEY
Our spiritual father
Baseball Prospectus
TO ANDREW
A brother since Bobby Meacham
Steven Goldman
Schrödinger’s Pennant Race
BY STEVEN GOLDMAN
In 1984, the Detroit Tigers got off to one of the fastest starts in baseball history, winning 35 of their first 40 games. Like the rest of their American League East rivals, the New York Yankees had been left in the dust. By the second week of May, the Tigers were 24-4 and the Yankees, 10-17, were in last place, 13.5 games out.
At that time, Yankees management had gotten in the habit of posting clever or inspirational sayings on the Yankee Stadium marquee. Some of these purportedly came directly from the owner, George Steinbrenner, who, nearly 30 years after his stint as a college football coach, had not lost his faith in the efficacy of “win one for the Gipper" -style messages, regardless of the medium. Yogi Berra managed the Yankees that year, and as the Yankees came to work that week, the marquee displayed one of his most famous aphorisms: “It ain’t over ’til it’s over.”
In fact, for the 1984 Yankees, it was over. Though Berra’s team, after some reorganization, recovered and went on to have the best second-half record in baseball that season, the Tigers had built up such a commanding lead that the Detroit team could not be caught.
Still, Yogi was right in his basic formulation. It isn’t over until it’s over. His only error, or the error of whoever ordered the message on the marquee, was not realizing that it was over. Like Schrödinger’s cat, every race exists in an indeterminate state, undecided until the last team is eliminated. The purpose of this book is twofold: to find the moments when the status of the cat changed from indeterminate to definitive—when one team’s chances of winning dwindled to nothing and another’s became assured—and then to identify why things played out as they did. From these moments and their causes, we’ll find lessons that have implications for the baseball teams of today. Hindsight will yield to foresight—and we’ll tell some great stories along the way.
Note the use of the word moments. Typically, we remember a race as having hinged on one fateful error or heroic feat—Fred Merkle’s Boner, Gaby Hartnett’s Homer in the gloamin’, and “Bucky [expletive] Dent”— but these are the climaxes of a more involved drama. To appreciate them fully, we must first understand how the teams planned and played so that they could arrive at the point that made heroism possible.
A wonderful thing about being a baseball fan today is all the wonderful tools that we have at our disposal. It used to be that our statistical understanding of the past was limited to what we could read on the back of a player’s bubblegum card. Now, thanks to work done by Bill James, countless members of the Society for American Baseball Research (SABR), Baseball Prospectus, Retrosheet, and Baseball-Reference.com (among many others), we have a constantly expanding set of information about the games and players of the past and newer, better tools with which to analyze it. It’s as if all those grainy blackand-white photos have been recast in high-resolution color and placed under the world’s most powerful magnifying glass. By definition, Baseball Prospectus has been a forward-looking entity, devoting its analysis to understanding the present so that we could better predict the future. With this book, we finally turn our attention—and those aforementioned tools—to the game’s past.
Our first step was to identify which races we wanted to talk about. Competition for the best record among ball clubs in a league setting— the rudimentary elements of a pennant race—go back at least as far as the formation of the National Association (a predecessor of the modern major leagues) in 1871. The first pennant race that was decided on the last day of the season occurred in the National League on October 5, 1889. The New York Giants defeated the Cleveland Spiders, thereby securing the flag over the Boston Beaneaters, who were upended by the Pittsburgh Alleghenys that same day. The list of all races that were inconclusive until the last day and those, like the 1984 American League East, that were essentially concluded by the end of April runs into the hundreds. If we had covered all of them with the depth we envisioned, this book would have become the Oxford English Dictionary of Pennant Races.
How then to cut the list down to not only a manageable handful but also the best handful? Far be it from us, purveyors of rationalism and confirmed debunkers of the conventional wisdom, to offer readers a subjective ranking. Being Baseball Prospectus, we had to invent a formula. To that end, Clay Davenport devised what he modestly suggested we call the Davenport Method. The method has two premises:
- ◆ The longer a race remains undecided, the better a race it is.
- ◆ A three-team race is better than a two-team race.
From there we experimented, adding and subtracting various nuances. We asked if a team should get extra credit for coming from behind to win, as some of the most-talked-about races did involve big comebacks, like the 1951 Giants-Dodgers conflict or the 1978 Yankees-Red Sox battle. Ultimately, though, those would still have been great races even if both Bucky Dent’s and Bobby Thomson’s fly balls had been caught on the warning track. We also explicitly rejected giving any extra credit for the teams involved; there is no reason that a Kansas City-Minnesota race should be scored lower than a Yankees-Red Sox battle, however more deserving the latter pairing might seem to the fans of those teams. Popularity is an issue of perception, not science.
In the end, the Davenport Method used the Playoff Odds Report, a projection that we feature on the Baseball Prospectus Web site each year (you can find the report at www.baseballprospectus.com/statistics/ps_odds.php). Each day of the season, we take the existing standings, along with team statistics like runs scored and allowed, to rate the strength of each team—the Yankees are a .600 team, Tampa Bay is a .400 team, and so on. We then look at the remaining schedule and “play” each game inside the computer. For a game between the Yankees and Devil Rays in Tampa, for example, we’d calculate the likelihood that a .600 team would beat a .400 team on the road (about 65.6 percent). Then we would roll some electronic dice to get a random number between 0 and 1 that is either less than .656 (thuh-huh-huh Yankees win!) or not (the Rays win). We track the wins and losses and move on to the next game, right through to the end of the season.
Within the current season, we play out the season from the current date to the final game (literally) a million times. Within a million versions of the season, some strange things are bound to happen, like the Devil Rays winning the pennant once every 50 or 100 seasons. The simulation gives us a snapshot of the likelihoods that, say, on June 1 the Yankees will have established a 60 percent chance of winning the division, the Red Sox 25 percent, the Jays 10 percent, the Orioles 3 percent, the Rays 1 percent. If the race weren’t competitive—what we call a dead race—we would have one team at 100 percent, and everyone else at zero. We simply measure how far a race is from being dead to get a score for that day; the highest possible score is one in which every team has an equal chance.
Ranking the pennant races using the same process as the Playoff Odds Report could be as simple as adding up the odds for all the days of a given season. Doing so produced the list in Table I-1. We also compiled a list of the worst pennant races by this method (Table I-2).
Table I-1 Top 10 Pennant Races as Determined by the Initial Playoff Odds Report Method
Rank | Race | Comments |
1 | 1967 AL | The year of the "impossible dream" Red Sox. |
2 | 1904 AL | An errant spitball from New York’ s Jack Chesbro hands a last- minute pennant to Boston. |
3 | 1915 Federal League | The Whales edge the Terriers, Rebels, and Packers in a marginal major league that blinked in and out of existence. |
4 | 1981 AL East | A race that didn’ t happen, thanks to the strike. |
5 | 1984 AL West | The Royals, Angels, and Twins stage a season-long battle in slow motion. |
6 | 1983 NL East | An aging Phillies squad wheezes past the Pirates and Expos. |
7 | 1974 AL East | An unexpectedly weak Orioles team struggles to pass an unexpectedly strong Yankees team. |
8 | 1965 NL | Not as well remembered as their 1962 fight, but the Giants and Dodgers were at it again. |
9 | 1926 NL | The first Branch Rickey-designed pennant winner edges a Reds team with one of the great forgotten starting rotations. |
10 | 1966 NL | The Dodgers, the Giants, and a Pirates team still a few years from breaking through do battle. |
Table I-2 The 10 Worst Races as Determined by the Initial Playoff Odds Report Method
Rank | Race | Comments |
1 | 2001 AL West | Seattle won 116 games and had a 20-game lead in July. |
2 | 1902 NL | The Pirates had fewer significant player defections during the contract wars with the NL, and dominated as a result. |
3 | 1884 Union League | This was the year Eleanor Roosevelt was born; the world had painless dentistry by then. |
4 | 1955 NL | The Dodgers ran away with the league on the way to their only Brooklyn championship. |
5 | 1939 AL | Joe McCarthy's fourth straight Yankees pennant winner; the team's only weakness was first base after Lou Gehrig stepped out. |
6 | 1969 AL East | One of Earl Weaver's better squads. |
7 | 1999 AL Central | The Indians won 97 games; no one else in the division was over .500. |
8 | 1995 AL Central | The same story as 1999, only the Indians were even better. |
9 | 1977 NL West | The Big Red Machine's pitching gave out and Tommy Lasorda's Dodgers roared past it. |
10 | 1885 American Association | Eleanor Roosevelt was still young, and as her dad was more into hunting and drinking than spectator sports, she probably didn't get to many games. |
These lists were not completely satisfactory. After all, we tend to think of the best pennant races as those that not only were close, but also have the most activity late in the season. Accordingly, we added a multiplier to give extra weight to the end of the season. We multiplied the daily rankings by the day of the season, so the 170th day of the season (September 18, if the season starts on April 1) counted 170 times more than the first day of the season.
This helped somewhat, but we still missed races in which one team had a big lead for most of the year but blew it in a short time; the higher scores at the end couldn’t make up for all the time when the race looked like a blowout. Playing with various permutations of this system produced the list with which we began work on the book:
- 1964 NL
- 1967 AL
- 1908 NL
- 1951 NL
- 1984 AL West
- 1934 NL
- 1981 AL East
- 1974 AL East
- 1973 NL East
- 1995 AL West
There is often a long time between the start of a book and its completion, and as we worked, Clay kept revising his system. “I realized later that I was handling tied seasons, which required playoffs, as if they were just a regular day of the season, when they really do deserve a special emphasis,” he said. “I played around with enhancing the time of the season, going to squares and cubes of the days as multipliers instead of just the day itself, making the 170th day almost 5 million times as important as the first day for scoring purposes.” Ultimately, Clay’s alterations produced a third, definitive list:
- 1967 AL
- 1959 NL
- 1972 AL East
- 1981 AL East
- 2001 NL Central
- 1948 AL
- 1949 AL
- 1908 NL
- 1964 NL
- 2003 NL Central
- 1973 NL East
- 1944 AL
The races discussed in this book represent an amalgamation of Clay’s second and third lists. We dropped the 1981 AL East race because it didn’t really happen—its ranking stems from disregarding the bifurcated schedule adopted in the wake of the players’ strike. The 2001 NL Central race, a tie between the Astros and Cardinals, was booted because the wild card meant there was nothing at stake; both clubs went to the playoffs. We also elected to retain the 1934 and 1951 National League races, which dropped out of the top 10 between lists two and three, because these were landmark races about which we had useful things to say.
Despite the care put into designing the Davenport Method, the rankings are not to be taken too seriously. Which pennant races are the “best” is ultimately a subjective call. If asked to choose from memory, the typical baseball fan would probably remember first those races that give the most visceral experience—that is, the one a favorite team was in—followed by a couple of landmark races he or she might remember hearing about. The Davenport Method is merely our way of framing the question.
Framing questions in a way that makes them easier to understand is what Baseball Prospectus is all about. Consider one of our key statistics, VORP, or value over replacement player. To have any meaning at all, baseball statistics require context. If, in a given year, the average player in a league hits .300, then the player who hits .275 isn’t having a good year. Conversely, if the league-average player hits only .240, the player who hits .275 is doing something moderately special. VORP goes a step beyond that, comparing a player’s performance not to the average but to that of a hypothetical replacement player, by which we mean freely available talent—a Triple-A veteran or major league 25th man who is barely qualified for his job. VORP asks the question How many runs has a batter generated (or in the case of a pitcher, prevented) beyond that of his replacement?
Now, you could eyeball all this for yourself if you had all the information at hand, facts like what the league hit, what the typical player at the position in question hit, where the player played (e.g., Coors Field or RFK?), and so on. VORP adjusts for park and league settings, providing that context for you.
Earlier we spoke of tools and magnifying glasses. In this book, we apply them to baseball’s past. Some would argue that we shouldn’t, that trying to gain a clearer picture of what happened (or what is happening) somehow diminishes the people or events being studied. A pleasing legend is always preferable to an unforgiving fact. Yet as we demonstrate throughout this book, if these tools had been available to the teams of the past, several great pennant races might have ended differently. As Christina Kahrl shows in her chapter on the 1934 National League pennant race, the Cubs eliminated themselves through a series of self-defeating trades that demonstrated their ignorance of park effects. In his chapter on the 1974 American League East race, Alex Belth discusses how a player “rebellion” against Earl Weaver led to the team’s bunting its way to a pennant—or so the players thought.
Why are new histories written of old events? Why not just let the first draft stand forever? The answer is that as time passes, greater perspective is possible. New information is uncovered, and new ways of analyzing old information are discovered. New minds, better informed, with better analytical tools, bring (one hopes) greater understanding. Thus the stories in this book are not twice told, but reimagined and newly understood. Even better, in dragging them back out of history’s attic, we had the privilege of communing with those personalities that animated the modern game—Branch Rickey, Satchel Paige, Casey Stengel, Bill Veeck, Dick Allen, Billy Martin, Earl Weaver, Tug McGraw, John McGraw, Dizzy Dean, Sig Jakucki (yes, we were shocked to see him here as well), and so many others. Baseball is the most accessible of sports: The players are not hidden behind masks or beneath helmets, not blurred by constant motion, but are knowable. In no other sport are the outcomes of games and races so susceptible to individual quirks, strengths, weaknesses, and prejudices. If “it ain’t over ’til it’s over,” it’s because the players’ very humanity skews the odds, upsets predictions, causes them to delight and disappoint. This book is a celebration of those men and their Schrödinger moments, standing on the cusp of success or failure, deciding to take or swing away.
An additional word about the statistics you will find in this book. Despite the foregoing, they are actually not terribly esoteric. Most frequently you will see the “slash stats,” typically rendered as (for example) .275/.367/.652. They represent the Cerberus of baseball statistics: batting average, on-base percentage, and slugging percentage. The numbers in the example were David Ortiz’s averages on the morning of April 24, 2007. They’re pretty good, but not as good as Alex Rodriguez’s .400/.453/1.053 on the same day. On the other hand, they’re far better than Brandon Inge’s .117/.194/.283. As indicated earlier, to put these statistics to good use, you need to know how the league is doing. On April 24, the average AL player was hitting .256/.327/.408, so you can see that Ortiz and Rodriguez were quite a bit above average, Inge miles below.
Some statistics have league and park context built in. We’ve already mentioned VORP. Another that you will come across in these pages is equivalent average, or EqA. This statistic takes a player’s total offensive output, adjusts for league and park features, and divides it by outs for an end product that looks very much like batting average. In fact, EqA is scaled so that it works the same way batting average does: .260 is about average; .300 is quite good; .190 is horribly bad. In 2006, the major league leader in EqA (with 300 or more plate appearances) was Travis Hafner of the Indians with .356. Hafner’s rates were .308/.439/ .659. The player with the worst EqA (in at least 300 plate appearances) was Clint Barmes of the Rockies with .206. He had batted .220/.264/ .335 while playing in Colorado. On the morning of April 24, 2007, the major league leader (minimum 75 plate appearances) was Jim Thome of the White Sox at .432 (batting .340/.553/.680). His antithesis, at .167, was Yankees outfielder Melky Cabrera (batting .200/.230/.200).
Finally, you’ll see WARP, or wins above replacement, not to be confused with VORP. WARP is the number of wins the player contributed above what a replacement-level position player or pitcher would have done. WARP adjusts for park and league context, and counts all of a player’s contributions—hitting, fielding, and pitching. When Ted Williams hit .406/.551/.735 in 1941, his WARP was 14.0. When third baseman Butch Hobson batted .250/.312/.408 and made 43 errors for the 1978 Red Sox, his WARP was 1.6. Visitors to our Web site, www.baseballprospectus.com, will note that WARP comes in different iterations. In this book, all uses of WARP refer to WARP3, a version adjusted to make comparisons across time possible.
At the beginning of each chapter, we’ve placed a Prospectus Box giving some pertinent facts about the season. Table I-3 is the Prospectus Box for the American League race of 1924, when the Washington Senators edged the Yankees by two games.
At upper left, you see the actual standings for the pennant race. The DIF column refers to how many days each team spent in first place. Date Elim is the date that each team was eliminated from the pennant race. Pythag is the so-called Pythagorean record for each team (technically, the Pythagenport third-order record), an “expected” win-loss record based on runs scored and allowed (this is explained in more detail in the 1908 “Paper Giants” chapter). In addition to the tripleslash league averages, the box also contains batting average on balls in play (BABIP), a measure of how the average pitcher did when he allowed hitters to make contact. There is also the more traditional ERA, strikeouts per nine innings pitched (K9), walks per nine innings pitched (BB9), and hits allowed per nine innings pitched (H9). In the lower center, we have the season’s leaders in batting runs above average (BRAA), which is the number of runs the team generated beyond what an average team would have done, given the same number of outs. Pitcher runs above average (PRAA) means how many more runs the team saved than the average staff would have saved, given the same number of outs. Finally, we have the individual WARP leaders for the season in question.
Table I-3 Example of a League Prospectus
Erwin Schrödinger’s cat never existed; the feline was an actor in a paradox designed to illustrate the complexities of quantum physics: that a thing (a particle or a pussycat) could exist in two states at once—in the case of the cat, both alive and dead. Eventually, the concept of decoherence was proposed as a solution: While the cat is hanging around waiting for Yogi Berra to come check on it and note whether it’s breathing or not, the universe is acting on the possibilities, rapidly eliminating the most improbable outcomes until all that is left is the cat’s inescapable fate. In the blink of an eye, the cat traverses the distance from “It ain’t over” to “It’s over.”
Genre:
- On Sale
- Aug 1, 2007
- Page Count
- 480 pages
- Publisher
- Basic Books
- ISBN-13
- 9780465008407
Newsletter Signup
By clicking ‘Sign Up,’ I acknowledge that I have read and agree to Hachette Book Group’s Privacy Policy and Terms of Use